A sourced snapshot of where asset and inventory management stands in 2026: the markets and their size, the problems that keep costing money, and the trends changing how organizations track their equipment.
Last updated: July 2026.
The terms, defined
"Asset management" covers several distinct disciplines that get used interchangeably, which is half the reason the market figures below disagree. A short glossary:
- Asset management (AM): the umbrella term for tracking and maintaining the things a business owns. The same phrase also names the financial industry that invests client money; everything here is about physical and IT assets, not investments.
- Enterprise asset management (EAM): managing physical assets across their whole lifecycle, from purchase through maintenance to disposal. The focus is uptime and reliability, and it's the broadest of the operational terms (IBM Maximo, Hexagon, Infor).
- Asset tracking: the day-to-day job of knowing where an asset is and what state it's in, using barcodes, QR or NFC tags, RFID, or GPS. It's a capability inside EAM rather than a separate discipline, and it's where UNIO24 sits.
- CMMS and APM: maintenance-focused systems inside EAM. A CMMS (computerized maintenance management system) runs work orders and preventive-maintenance schedules; APM (asset performance management) adds condition monitoring and predictive maintenance.
- IT asset management (ITAM): the same lifecycle idea applied to IT, split into HAM (hardware such as laptops, servers, and network gear) and SAM (software licenses, compliance, and spend). See our IT asset management page.
- Fixed asset management: the accounting view of those same physical assets, tracked for depreciation, tax, and audit rather than day-to-day operation.
- Inventory management: not an asset discipline at all. It covers the stock that flows through a business (raw materials, consumables, goods for sale), not the assets you keep and reuse. We break the difference down in asset management vs inventory management.
The core problems
For all those categories of software, the default tool in small and mid-sized businesses is still the spreadsheet. The clearest read on asset tracking specifically comes from Wasp Barcode's State of Small Business Report, which found only 16% of small businesses ran dedicated asset-tracking software, behind the 32% on spreadsheets and barely ahead of the 12% still on pen and paper. That survey is older (2016–2017), and it remains one of the few asset-specific breakdowns of its kind.
We can confirm the same inertia still holds in 2026, from our own side. UNIO24 publishes a range of free downloadable templates, including a general asset tracking spreadsheet, an equipment inventory template, an IT asset inventory template, a tool inventory template, a maintenance log, and an equipment sign-out sheet. Even with a free product one click away, we see only about one signup for every 10 to 12 template downloads (about 10%), each of those users then trying the software. More than nine in ten people take the template and stay on the spreadsheet. The file you already have and understand beats the better tool, even when the better tool is free.
Inaccuracy in spreadsheets is built in. The most rigorous field audits of real operational spreadsheets found errors in at least 86% of them (Panko, EuSpRIG 2000, an academic study of 367 spreadsheets, dated but still the most-cited audit). A spreadsheet has no built-in check that a given row still matches a real, findable asset, so those errors accumulate unnoticed until an audit or a missing item surfaces them.
The loss is hard to see and expensive. When the spreadsheet is the system of record, its errors become missing assets and phantom stock. That cost is hard to measure directly for equipment, but the nearest measured analog is retail: US shrink, inventory that exists on paper but not on the shelf, ran to 1.6% of sales, or $112.1 billion, in FY2022 (NRF National Retail Security Survey 2023; the NRF paused this annual report after 2023, so this is the last comparable figure).
Downtime is where poor tracking gets costed at scale. Siemens' True Cost of Downtime 2024 study, measured across the world's largest companies, is blunt about the numbers:
- The Fortune Global 500 lose ~$1.4 trillion a year to unplanned downtime, equal to 11% of their revenues or the GDP of Spain.
- A single hour of downtime costs $2.3 million in automotive, $36,000 in fast-moving consumer goods, and up to $150,000 for small and mid-sized manufacturers.
- Per-hour downtime cost has doubled in five years (automotive +113%, heavy industry +319%, against 19% US inflation over 2019–23).
- The average large plant still loses 27 hours a month, down from 39 in 2019 but more than a full day of production.
Retirement is the last blind spot. Assets cost money at end of life too. The UN Global E-waste Monitor 2024 (ITU and UNITAR) reports a record 62 million tonnes of e-waste in 2022, on track to hit 82 million tonnes by 2030, with only 22.3% documented as properly collected and recycled and e-waste now rising five times faster than recycling. A large share is retired IT and business equipment that was never properly accounted for. Disposal is also the one lifecycle cost most companies pay in isolation: many write a cheque to retire an asset without ever having tracked what it actually cost to own, from purchase through maintenance, downtime, and retirement together. Without a record that spans the whole cycle, an asset's total cost of ownership stays invisible until the final bill lands. A clean end of life (data wiped, value recovered, disposal documented) starts with an accurate record of what you own, which we cover in IT asset disposition.
Sizing the market
A whole software market has grown up to fix these problems, and it is oddly hard to size, because "asset management" is not one market. Depending on where you draw the line it spans several overlapping software categories, each sized differently, so the honest answer is always a range rather than a single headline.
For large businesses, enterprise asset management (EAM) is the broad category, and even here the analysts diverge:
- Grand View Research valued it at $7.65 billion in 2024 and projects it will reach $19.68 billion by 2030, a 17.2% CAGR.
- MarketsandMarkets is more conservative, valuing it at $5.87 billion in 2025 and forecasting $9.02 billion by 2030 at a 9.0% CAGR.
Both agree on the direction (steady growth driven by IoT, cloud deployment, and the shift from reactive to predictive maintenance), but the roughly 2× gap in their 2030 forecasts is why no single market-size number should be taken at face value.
Draw the boundary tighter and you reach the layer closest to how most teams actually track equipment. The IoT-based asset tracking and monitoring market (sensors, tags, and the software that locates and monitors physical assets) was worth $5.02 billion in 2024 and is projected to reach $9.16 billion by 2029 at a 12.8% CAGR (MarketsandMarkets, 2024).
Our own research into search demand confirms the appetite for asset-management software is real. Across the core asset, inventory, and maintenance software categories, US searches run to around 36,000 a month, which is real, standing demand.
Company size shapes how that demand converts. Smaller firms buy deliberately: Software Advice found that among 181 recent fixed-asset-software buyers, about half with fewer than 50 employees, 42% budgeted $210–$410 a month and 68% wanted a best-of-breed tool rather than an ERP module, with manufacturing, construction, and nonprofits leading demand.
The field those buyers choose from is crowded. The major software directories (Capterra, GetApp, and Software Advice, which share a single Gartner Digital Markets catalog) list roughly 360 to 460 asset-tracking products, with about 300 more filed under fixed-asset management. New entrants keep arriving: Tracxn counted 1,264 IoT asset-tracking startups in July 2026, 338 of them funded and 146 at Series A or beyond. These are catalog and tracker snapshots rather than hard market data, and they span vendors of every size, but the shape is clear: anyone shopping for a purpose-built tool has hundreds of options to wade through.
Most early-stage startups do not last, though, and that churn is its own barrier to adoption. For a small or mid-sized business, committing to a tool whose vendor might fold within a year or two is a real risk, and it makes leaving the spreadsheet harder to justify for exactly the companies that would gain the most from switching.
Enterprises hit friction at the other end: for a large organization, moving onto a full asset-management or ERP platform is a project with a long implementation timeline, not just a purchase. The move to cloud and SaaS has significantly shortened both buying and rolling one out: Panorama Consulting's ERP Report shows the median implementation falling from 15.5 months in 2024 to 9 months in 2025–26. Nine months is still a very long time to stand up a system, and rollouts often slip: in the 2026 report about a quarter of projects ran over schedule and more than a quarter over budget, usually over organizational sign-offs or unplanned technology needs. (These are ERP-wide benchmarks, the closest proxy for the EAM suites large asset teams run, since no asset-management-specific figure is published.)
The trends
The teams still on spreadsheets are the exception the rest of the market is moving away from, and four shifts define where tracking is heading.
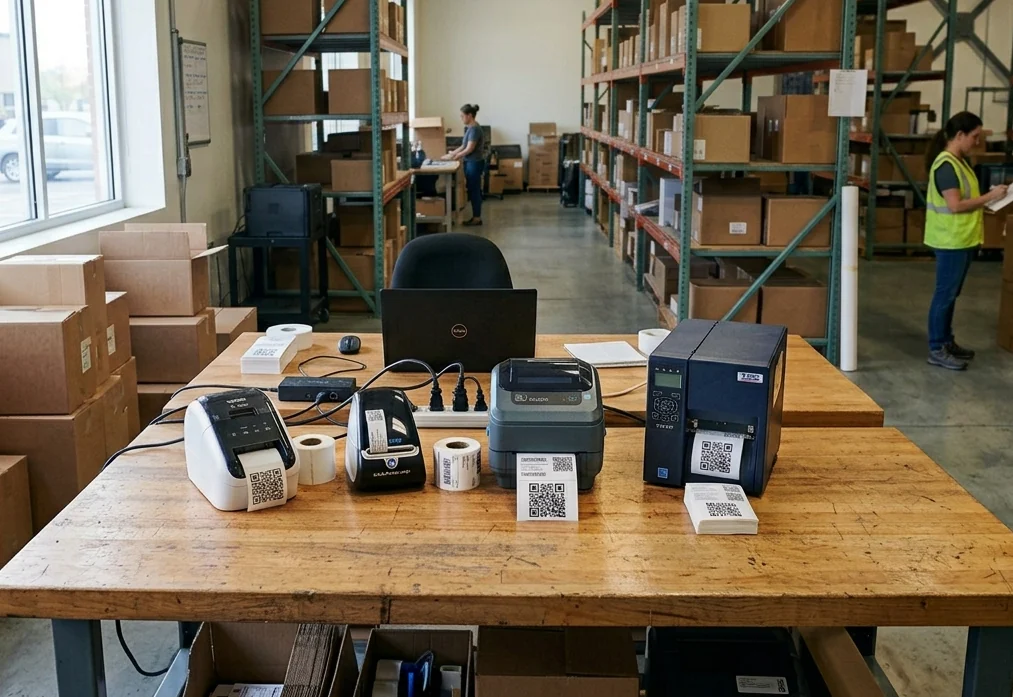
Tagging the asset is the practical starting point. However you record an asset, tracking only works if the physical item carries a label you can scan, and there are four common ways to do it: RFID chips, printed QR stickers, NFC tags, and GPS trackers. They differ mostly in cost and the hardware needed to read them. RFID can scan many items at once without line of sight, which is why warehouses are adopting it: Zebra Technologies' 2023 Global Warehousing Study (1,400+ operations leaders) found 58% plan to deploy RFID by 2028 and 91% are investing to increase visibility. RFID's catch is the dedicated readers it requires, which is why cheaper, phone-scannable tags win for most asset tracking. QR codes are becoming universal infrastructure: GS1's Sunrise 2027 initiative is moving retail from 1D barcodes to 2D and QR codes by the end of 2027, and QR scan volumes jumped 20–50% across most markets between 2024 and 2025 (Bitly, 2026). NFC needs no reader at all: 65% of smartphones are already NFC-capable, on the way to 75%, with 1.7 billion NFC devices shipping a year by 2028 (ABI Research). Any modern phone reads a QR or NFC tag with no extra hardware, so those two are the practical entry point for most teams managing assets. These adoption figures come from retail, warehouse, and inventory operations, since that is where the shift is measured, but the same move toward QR, NFC, and RFID labels is playing out in asset tagging, for the same reason: cheap labels and a reader already in everyone's pocket. GPS trackers sit at the higher-cost end and earn their place on the assets that actually move: vehicles, trailers, and field equipment that need real-time location rather than a scan on arrival.
Spend is concentrating on tracking and maintenance. Grand View Research's Asset Management Market analysis puts location- and movement-tracking as the largest function segment (35.0% of revenue in 2023) and repair and maintenance as the fastest-growing (a 38.3% forecast CAGR), with the solution layer of RTLS, barcodes, GPS, and tags making up 54.7% of the market. Geographically, North America holds the largest share (33.0% in 2023), while Asia-Pacific is the fastest-growing region (a 37.8% forecast CAGR). (That report's headline dollar figure spans a much broader scope, including aviation and infrastructure, so we cite its segment mix rather than its top-line size.)
IoT is pushing maintenance from reactive to predictive. Siemens estimates that fully adopting condition monitoring and predictive maintenance across the Fortune Global 500 could save 2.1 million downtime hours a year, $388 billion through higher productivity, and $233 billion through lower maintenance costs. All of it depends on knowing the state of every asset before it fails, which starts with tracking it. See how the numbers vary by sector in our asset utilization benchmarks by industry, or model your own with the maintenance cost calculator.
AI in asset management. Flexera's 2026 State of ITAM Report (512 IT asset management professionals) reports that 48% of organizations were audited in the past year, that tracking or adopting new AI applications is now the top challenge overall, cited by 84% of respondents, and that 59% say wasted AI spend rose year over year. For now the trend is more pressure than payoff: only 31% report having real visibility into their AI software today, so AI is spreading through asset and IT estates faster than teams can govern it or measure a return. As the asset base grows more connected and more AI-driven, knowing what you own and where it is stops being a clerical task and becomes a control problem, which is how we approach IT asset management.
Methodology & sources
Figures are attributed inline to their primary source. A few notes on how to read them:
- Market-size figures are firm estimates and vary by scope. We cite both Grand View Research and MarketsandMarkets and present the range rather than a single number.
- Search-demand figures are estimates, not exact counts. They come from Google Ads Keyword Planner (US, English, trailing 12 months to June 2026) and are rounded averages by design.
- Survey figures reflect the sample described (Zebra: 1,400+ respondents, 2023; Flexera: 512 ITAM professionals, 2026; Software Advice: 181 buyers, 2023–24; Wasp Barcode: small-business owners, 2016–17).
- Some figures are dated or analogous, and we say so inline. The small-business tool split (Wasp) is from 2016–17 and cited to show how long the pattern has held; the spreadsheet-error data is academic (Panko, 2000) but remains the most-cited audit; the retail-shrink figure (NRF, FY2022) is the last in a series the NRF paused after 2023, used here as the nearest measured proxy for physical-asset loss, not a direct measure of it.
- Segment shares, not headline size, from Grand View's broad "Asset Management Market" report — that report's dollar total spans a much wider scope (aviation and infrastructure asset management) than the tracking-software figures elsewhere on this page, so only its segment mix is cited.
- QR and NFC figures are adoption and enabler data, not asset-tracking-specific. No primary source measures QR/NFC use for asset tracking directly, so we cite the broader adoption signals (QR scan growth, the GS1 2D transition, smartphone NFC penetration) that make phone-scannable tags a practical option.
- First-party figures are UNIO24's own observed data. The template-download-to-signup ratio comes from our site analytics, rounded to a range, and reads as a directional signal of spreadsheet stickiness rather than a precise conversion rate.
- Vendor and startup counts are catalog and tracker snapshots. The directory figures (Capterra, GetApp, and Software Advice share one Gartner Digital Markets catalog) and the Tracxn startup tracker cover vendors of all sizes and drift over time, so they show the shape of the field rather than a precise census.
- Implementation-time figures are ERP-wide, used as a proxy for EAM. No primary source publishes an asset-management-specific rollout time, so we cite Panorama Consulting's ERP Report, since large EAM deployments are implemented as, or alongside, ERP projects.
Sources:
- UN Global E-waste Monitor 2024 (ITU/UNITAR)
- Siemens, The True Cost of Downtime 2024
- Grand View Research, Enterprise Asset Management Market
- MarketsandMarkets, Enterprise Asset Management Market
- MarketsandMarkets, IoT-based Asset Tracking & Monitoring Market
- Zebra Technologies, 2023 Global Warehousing Study
- Flexera, 2026 State of ITAM Report
- NRF, National Retail Security Survey 2023
- Panko, Spreadsheet Errors (EuSpRIG 2000)
- Wasp Barcode, State of Small Business Report
- Grand View Research, Asset Management Market
- Bitly, State of QR Code Scans 2026
- GS1 US, Sunrise 2027
- ABI Research, NFC Forum technology roadmap
- Panorama Consulting Group, ERP Report (2024 & 2026)
- Google Ads Keyword Planner
Cite this page
Found a stat useful? You're welcome to cite or republish these figures with attribution and a link back to this page:
Asset Management Statistics 2026, UNIO24. https://unio24.com/blog/asset-management-statistics