SEE THE WHOLE PICTURE
See what your assets are actually doing.
Pre-built dashboards across utilization, cost, lifecycle, and loss patterns. Drill from any chart straight into the asset record. The system surfaces the decisions worth making before they hit the budget.
What changes when assets stop being a black box.
Pre-built dashboard surfaces
Asset, Tickets, Work Orders, Inventory, Audit, License. Every module has its own analytics view, no setup required.
Drillable to source data
Every chart drills into the asset, ticket, or work-order record behind it. No black-box numbers, no separate query layer.
Data-engineering setup
No ETL pipeline, no warehouse, no consultant. UNIO24 dashboards consume the same operational data the platform already collects.
Stale dashboards
Charts auto-refresh on every transaction: work orders close, assets transfer, parts deplete, audits complete. No nightly batch, no scheduled sync.
Utilization: which assets earn their keep.
Check-in / check-out events, hour-meter readings, and scan history feed utilization automatically. Which laptops sit unused? Which forklifts are running flat out? Which conference-room AV cart never leaves Room 304? Stop buying equipment you already have idle, and stop replacing the equipment that is overworked.
Per-asset utilization % over any time range
Idle assets flagged for redeployment, with last-used date
Peak usage hours, days, and seasons
Fleet-level utilization across categories, locations, and teams
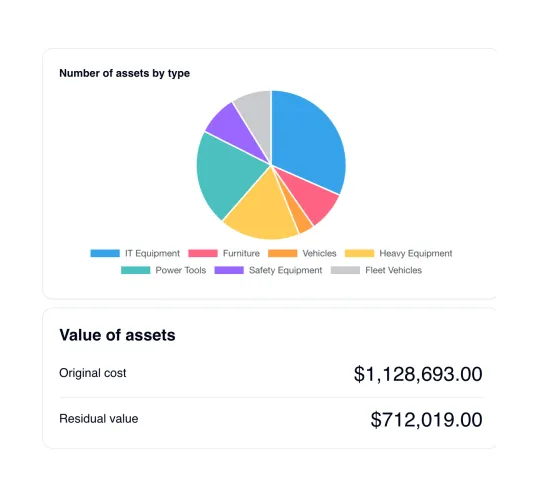
Know what your asset base is worth.
Every asset carries a purchase price and a current residual value, so the portfolio total is always live: what you paid, what it is worth now, and how that capital breaks down by category. No spreadsheet reconciliation at quarter-end. The number is on the dashboard, and the composition pie shows at a glance where the value sits.
Original cost vs current residual value across the whole portfolio
Asset composition by type: where your capital is concentrated
Price and residual value carried on every individual asset record
A clear figure for budgeting, insurance, and depreciation reviews
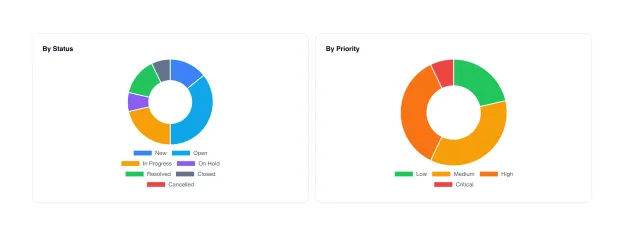
Spot the patterns in what goes wrong.
A flat list of tickets hides the shape of the problem. The analytics view breaks every request down by status and by priority, and charts volume over time, so a recurring fault or a creeping backlog shows up as a pattern instead of a one-off. Switch the period and the same view answers "is this getting better or worse?"
Requests broken down by status: new, open, in progress, resolved
Priority mix: how much of the queue is high or critical
Volume over time surfaces recurring problems, not one-offs
Choose the window (today, 7, 30, or 90 days) and compare
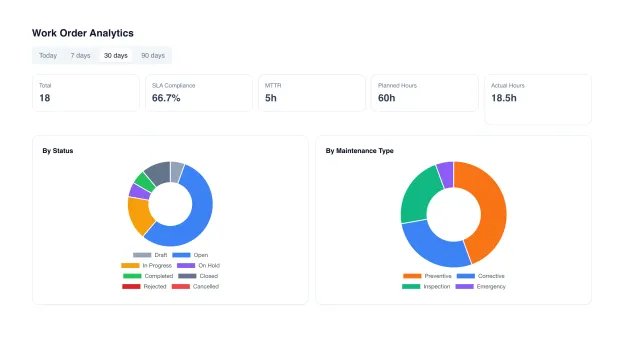
Per-module analytics, built in.
Each operational module ships with its own analytics. No BI tool, no data engineering. Work Orders reports total volume, SLA compliance, mean time to repair, and planned-versus-actual labor, broken down by status and maintenance type. Tickets does the same for requests by status, priority, and resolution trend. The asset dashboard adds value, composition, and expiring-license widgets. Pick a window (today, 7, 30, or 90 days) and the whole picture refreshes.
Work Orders: total, SLA compliance, MTTR, planned vs actual labor
Work Orders & Tickets: by status, priority, and maintenance type
Tickets: request volume and resolution trend over your chosen window
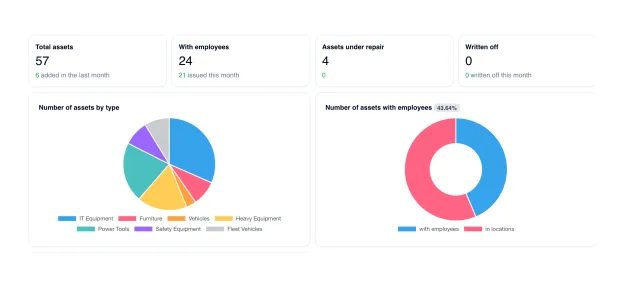
Asset dashboard: value, composition, and expiring-license widgets
What separates real asset analytics from end-of-month spreadsheet pivots.
Most operations teams still build asset reports from a CSV export, a pivot table, and an evening of cleaning. Here is what changes when analytics is a first-class part of the asset platform.
| Capability | UNIO24 AnalyticsRecommended | CSV + spreadsheet pivots | External BI tool (Power BI / Tableau) |
|---|---|---|---|
| Setup & access | |||
| Pre-built dashboards out of the boxNo setup time before first insight | Yes | Build pivots manually | Build from scratch (weeks) |
| No data-engineering requiredNo ETL, no warehouse, no consultant | Yes | Free but slow | Often requires a data team |
| Auto-refresh on every transactionCharts update as work orders close, assets transfer, parts deplete | Yes | Manual refresh | Scheduled sync (often nightly) |
| Drill-down & context | |||
| Drill from chart to asset recordOne click from a number to the underlying asset card | Yes | No | Often partial, depends on data model |
| Cross-module visibility in one viewAssets + tickets + work orders + audit data in the same dashboard | Yes | No | Requires custom modelling |
| Per-asset history and timelineOpen any asset and see every event, cost, and audit | Yes | Reconstruct from multiple sheets | Custom build |
UNIO24 is a platform. Analytics is one module.
Explore what else your team gets, all included, all with unlimited users.


Common questions about analytics in UNIO24
How often do dashboards refresh?
In real time. Numbers update as transactions happen: when a work order closes, when an asset is scanned, when parts deplete, when an audit completes. No nightly batch, no scheduled sync. Open the dashboard and the data is current to the last action.How long is historical data kept?
Indefinitely (or per your data retention policy). Open any asset and see its full history (every audit, every repair, every transfer, every parts consumption) going back to the day it was added. Multi-year trends become searchable across the platform.Can analytics handle a 50,000-asset fleet?
Yes. UNIO24 is built for fleets ranging from 50 assets (free tier) to multi-tenant deployments with tens of thousands of assets. Pre-built dashboards stay responsive at scale; for very large filtered views, exports run as background jobs to avoid browser timeouts.
Have a question we did not cover? Talk to us
