How to Set Up Asset Tracking in Spreadsheets: A Practical Guide
Master asset tracking in spreadsheets: Practical guide to organizing equipment, preventing losses, and optimizing business asset management with Excel
How I stopped losing equipment and learned to love Excel
When I first took on asset management at my company, it was total chaos. Laptops went missing, projectors "borrowed" for meetings disappeared for weeks, and whenever someone asked "who had the camera last?" everyone just shrugged. Sound familiar?
I've been through the journey from paper logs to complex enterprise systems, and here's what I've learned: for small and mid-sized businesses, a well-designed spreadsheet gets you 80% of the solution at 20% of the cost. In this asset tracking excel guide, I'll share the system I've built through years of trial and error, showing you how to track assets in Excel step by step.
Why Bother Tracking Assets?
Before diving into the technical details, let's be honest about why this matters. Asset tracking isn't bureaucracy for bureaucracy's sake. It's a tool that helps you understand what you have, where it is, and what it's worth.
In my experience, proper asset tracking has helped avoid duplicate purchases (we once almost bought a third projector while two were collecting dust in a closet), track depreciation for accounting and tax purposes, plan equipment replacements before things break down, and quickly locate the stuff you need.
System Architecture: Five Key Components
An effective spreadsheet asset management system consists of five interconnected modules. Each serves its own purpose, but together they create the complete picture.
1. Asset Register
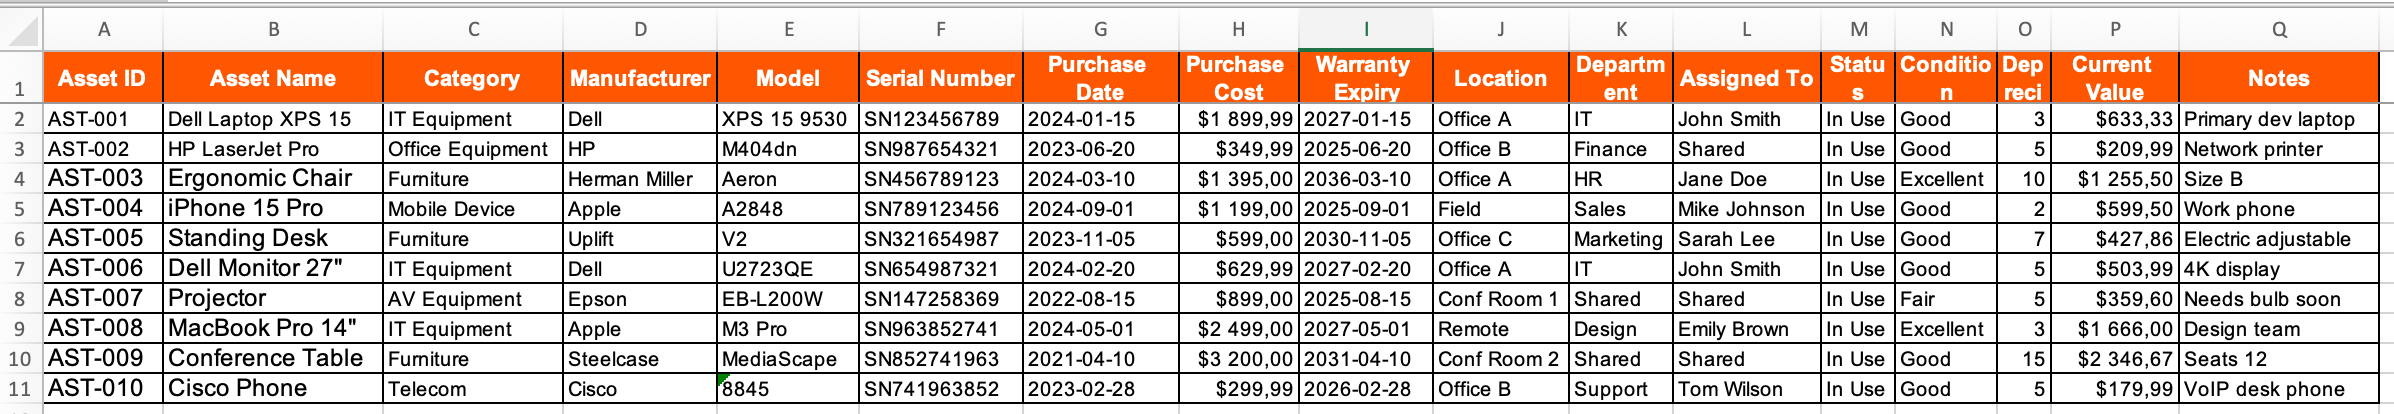
This is the heart of your entire system: the asset register spreadsheet is a single database of all company property. Based on my experience, here's the minimum set of fields that actually works:
Asset Identification
Every asset needs a unique identifier. I use the format AST-001, AST-002, and so on. Simple, readable, easy to say over the phone. Beyond that, you'll need asset name, category (IT equipment, furniture, vehicles), manufacturer, model, and serial number.
Financial Information
This section is critical for accounting and planning: purchase date, purchase cost, warranty expiration, useful life in years, and current value (calculated automatically).
Location and Accountability
Where the asset is located, which department owns it, and who's responsible for it. Without this data, your tracking is essentially fiction.
Status and Condition
Status indicates whether an asset is in use, available, in repair, or retired. Condition is a subjective assessment of physical wear: excellent, good, fair, or poor.
Here's an example entry from a real register:
2. Dashboard
The register is great, but nobody's going to stare at hundreds of rows every day. You need a summary panel with key metrics. Here's what I put on my dashboard:
Overall Statistics:
- Total number of assets
- Total purchase value
- Current value (after depreciation)
- Accumulated depreciation
Status Breakdown:
- How many assets are in use
- How many are available
- How many are in repair
- How many are retired
Category and Department Breakdowns:
- Asset count and value by type
- Distribution across departments
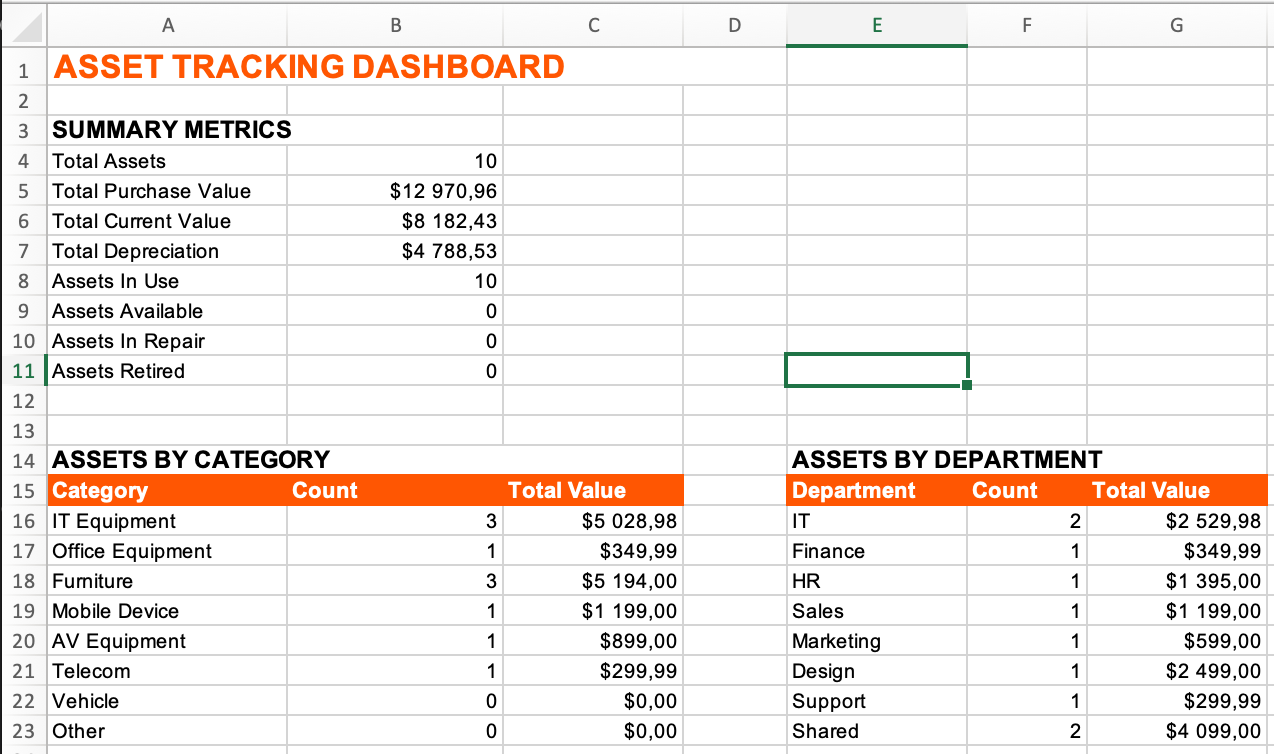
The magic of the dashboard is that it updates automatically when data changes in the register. No manual calculations needed.
3. Maintenance Log
Equipment breaks. That's just reality. The question is how you track it. The maintenance log captures the complete history of repairs and preventive maintenance.
Record structure:
- Unique log ID (
MNT-001) - Asset ID (links to register)
- Service date
- Type: preventive maintenance or repair
- Description of work
- Performed by
- Cost
- Next service due date
- Status: scheduled, completed, canceled
Example entry:
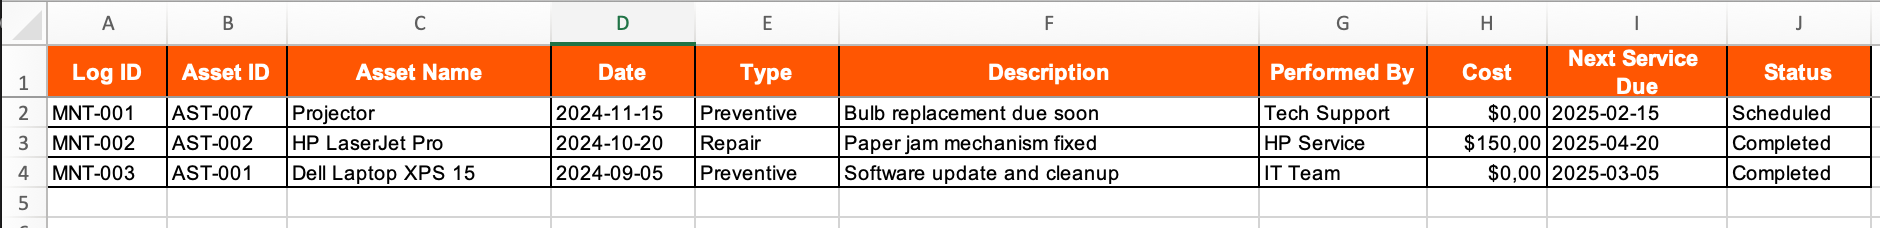
Over time, this log becomes an invaluable source of information: you can see which equipment breaks down most often, how much money goes into maintaining each asset category, and when it's time to replace aging equipment.
4. Check-out Log
If your company lends equipment to employees temporarily (projectors, cameras, test devices), you can't do without a check-out log. It answers the questions: who took it, when, why, and when will they return it.
Check-out log fields:
- Transaction ID
- Asset ID
- Checked out by
- Check-out date
- Expected return date
- Actual return date
- Days out
- Purpose
- Notes
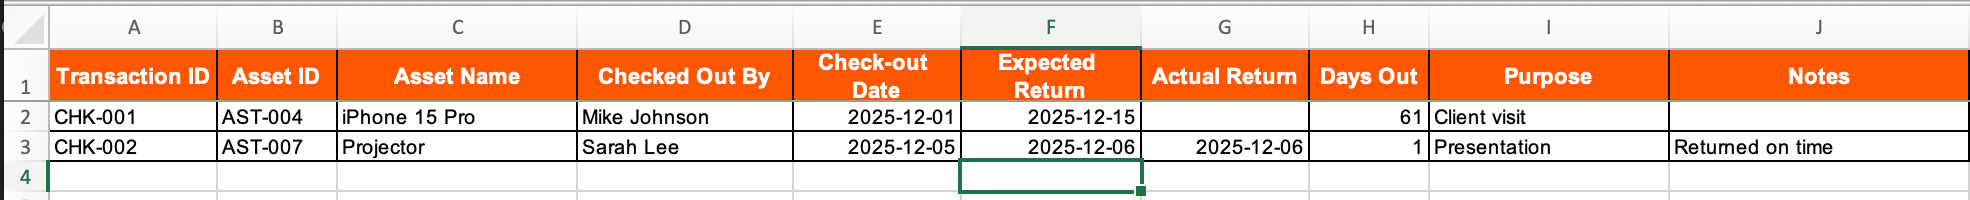
The key metric here is "Days Out." If the expected return date has passed and the actual return date is empty, that's a red flag. I set up conditional formatting to highlight these rows in red.
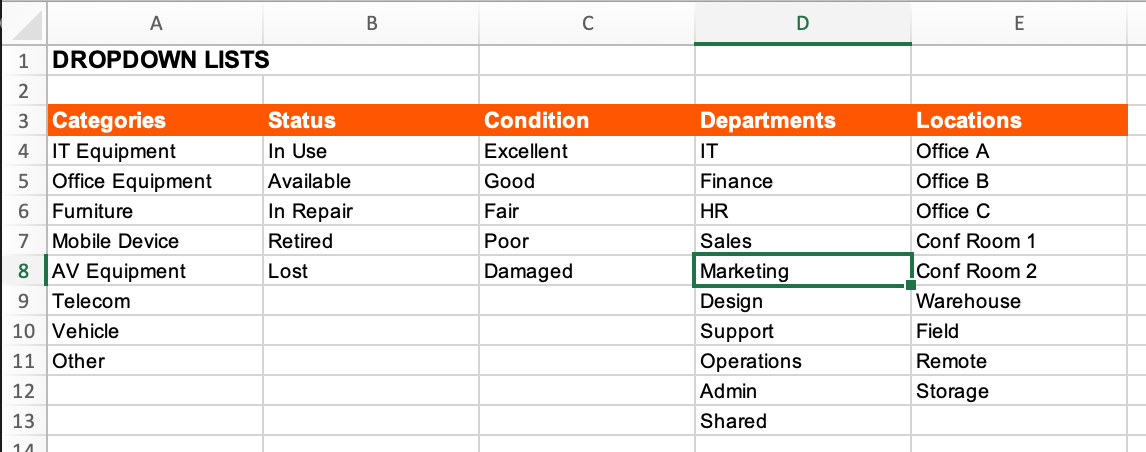
5. Settings (Lookup Tables)
Last but not least, centralized value lists for dropdown menus:
Asset Categories: IT Equipment, Office Equipment, Furniture, Mobile Device, AV Equipment, Telecom, Vehicle, Other
Statuses: In Use, Available, In Repair, Retired, Lost
Condition: Excellent, Good, Fair, Poor, Damaged
Departments: IT, Finance, HR, Sales, Marketing, Design, Support, Operations, Admin, Shared
Locations: Office A, Office B, Office C, Conf Room 1, Conf Room 2, Warehouse, Field, Remote, Storage
Centralized lookup tables solve two problems. First, they ensure data consistency: no more "IT," "I.T.," "it," and "Information Technology" all in the same column. Second, they simplify data entry through dropdown lists.
Formulas and Automation: Let Excel Do the Heavy Lifting
The main advantage of spreadsheets over paper logs is automatic calculations. Here are the key formulas I use.
Calculating Current Asset Value
Building an asset depreciation spreadsheet starts with straight-line depreciation, the simplest and most straightforward method. The formula calculates how many years have passed since purchase and reduces the value proportionally over the useful life.
=MAX(0, Purchase_Cost - (Purchase_Cost / Useful_Life) * YEARFRAC(Purchase_Date, TODAY()))
The MAX(0, ..) function prevents the value from going negative after the depreciation period ends.
Counting Assets by Status
=COUNTIF(Status_Column, "In Use")
=COUNTIF(Status_Column, "Available")
=COUNTIF(Status_Column, "In Repair")
Sum of Value by Category
=SUMIF(Category_Column, "IT Equipment", Cost_Column)
Days Until Warranty Expiration
=MAX(0, Warranty_Date - TODAY())
I highlight assets with expiring warranties (less than 90 days) in yellow, a signal to check renewal options.
Days Checked Out
For the check-out log:
=IF(Actual_Return="", TODAY()-Checkout_Date, Actual_Return-Checkout_Date)
Practical Implementation Tips
Start with a Physical Inventory
Before building your system, you need to understand what you're tracking. I recommend physically walking through your office with a clipboard. Yes, it takes time. Yes, you'll find forgotten equipment in unexpected places. That's normal.
Set a Tracking Threshold
You don't need to track everything. In my practice, the threshold is $100. Staplers and mice don't make it into the system, but a $150 keyboard does. Choose a threshold that makes sense for your organization.
Use Physical Labels and QR Codes
Every asset in your system should have a physical label with its ID. Without a label, the connection between the spreadsheet entry and the real object breaks down. Asset tagging with QR codes is a total game changer.
Why QR Codes Beat Simple Labels
A text label with AST-001 works, but it has limitations. Someone has to read the code, open the spreadsheet, and find the right row. When you're inventorying hundreds of assets, this becomes a nightmare. A QR code solves the problem with a single scan.
What to Encode in the QR Code
Option 1: Asset ID only. The simplest approach: the QR code contains just AST-001. After scanning, you manually look up the record in your spreadsheet. Good for getting started.
Option 2: Direct link to the record. If you're doing equipment tracking in Google Sheets or SharePoint, the QR code can contain a direct link to the asset's row. Scan it and you see all the data immediately.
Option 3: Structured data. The advanced option. Encode basic information in the QR: ID, name, serial number, assigned user. Works even offline.
How to Create QR Codes
For a small number of assets (up to 50), free online generators work great: QR Code Generator, GoQR.me, QRCode Monkey. Enter the asset ID, download the image, print it on a label.
For bulk generation, I use scripts. In Excel, you can create a formula that generates URLs for a QR code generator API, then batch-download all the images. Or use the Python qrcode library. Ten lines of code and you've got a folder full of QR codes for all your assets.
Practical QR Labeling Tips
Size matters. The QR code needs to be large enough for reliable scanning: at least 0.75 × 0.75 inches. On small equipment, this can be a challenge.
Always include text. Print the asset ID next to the QR code. If the code gets damaged or the camera won't work, you need a fallback option.
Choose the right material. For office equipment, regular paper labels work fine. For equipment used in manufacturing or outdoors, you'll need laminated or metal tags.
Standardize placement. Agree on where to stick the label: on laptops, the bottom cover; on monitors, the back right corner; on furniture, inside a drawer. This speeds up inventory counts.
Scanning and Inventory
Any modern smartphone scans QR codes through the standard camera app. For mass inventory, it's more convenient to use specialized apps (Orca Scan, QR & Barcode Scanner) that keep a log of scanned codes and can export data to CSV.
The inventory process becomes simple: walk through the office, scan all the labels, export the list to a spreadsheet, compare with the register. Discrepancies show up immediately.
Integration with Your Spreadsheet
In an advanced setup, you can configure the system so the QR code contains a link to a Google Form tied to that specific asset. An employee scans the code and lands directly in a check-out/return form or an issue report. Data flows automatically into your spreadsheet. That's pretty much a full-fledged system without writing a single line of code.
Assign an Owner
The system only works if someone maintains it. Designate a person who will add new assets, update statuses, and track check-outs. Ideally, this should be part of someone's job description.
Conduct Regular Audits
Once a quarter, verify that the data in your spreadsheet matches reality. Assets get moved, people leave the company, equipment gets retired. Your system needs to reflect this.
Common Mistakes and How to Avoid Them
Over the years, I've made them all. Learn from my experience.
Too many fields. The first version of my system had 30 columns. Half of them stayed empty. Start with the minimum and add as needed.
No data validation. Free-text entry is the enemy of analytics. Use dropdown lists wherever possible.
No backups. Files can be accidentally deleted or corrupted. Keep a copy in the cloud or on an external drive.
Multiple versions. "asset_tracking_final_v2_FINAL.xlsx", a classic. Designate one master file and stick with it.
Ignoring retired assets. Deleting records from the register is a bad idea. Change the status to "Retired" but keep the history.
Conclusion
Asset tracking in spreadsheets is a great way to get started. They're free, flexible, and everyone knows how to use them. But let's be honest: even with a perfectly configured spreadsheet, problems are inevitable.
Files get accidentally overwritten. Two people edit at the same time and data conflicts. Formulas break from one careless action. Mobile access for inventory? That's a whole other headache. And try recovering the change history when someone "accidentally" deleted a row a month ago.
I've been down this road and realized: spreadsheets are great for learning the process and handling small volumes, but for serious work, you need a dedicated tool.
My recommendation, try UNIO24. It's a cloud-based asset management service that solves all the spreadsheet problems: multi-user access without conflicts, a mobile app for inventory, built-in QR code support, automatic notifications for warranty expirations and scheduled maintenance, and complete change history.
Best of all. You can start using UNIO24 completely free. No trial period, no hidden limitations. Just sign up and get to work. If your needs grow, there are paid tiers, but for small businesses, the free version is often all you need.
Start with a spreadsheet to understand your processes. By the way, you can use the template I've already built completely free, download the Asset Tracking template. All the worksheets, formulas, and dropdown lists I've discussed in this article are already set up. Just fill in your data and start working.
And when you hit the limitations of spreadsheets, move to UNIO24. It's the logical next step that will save you hours of work and a lot of frustration.
If you have questions about setting up asset tracking or want to share your own experience, drop a comment below. I'd love to hear from you!